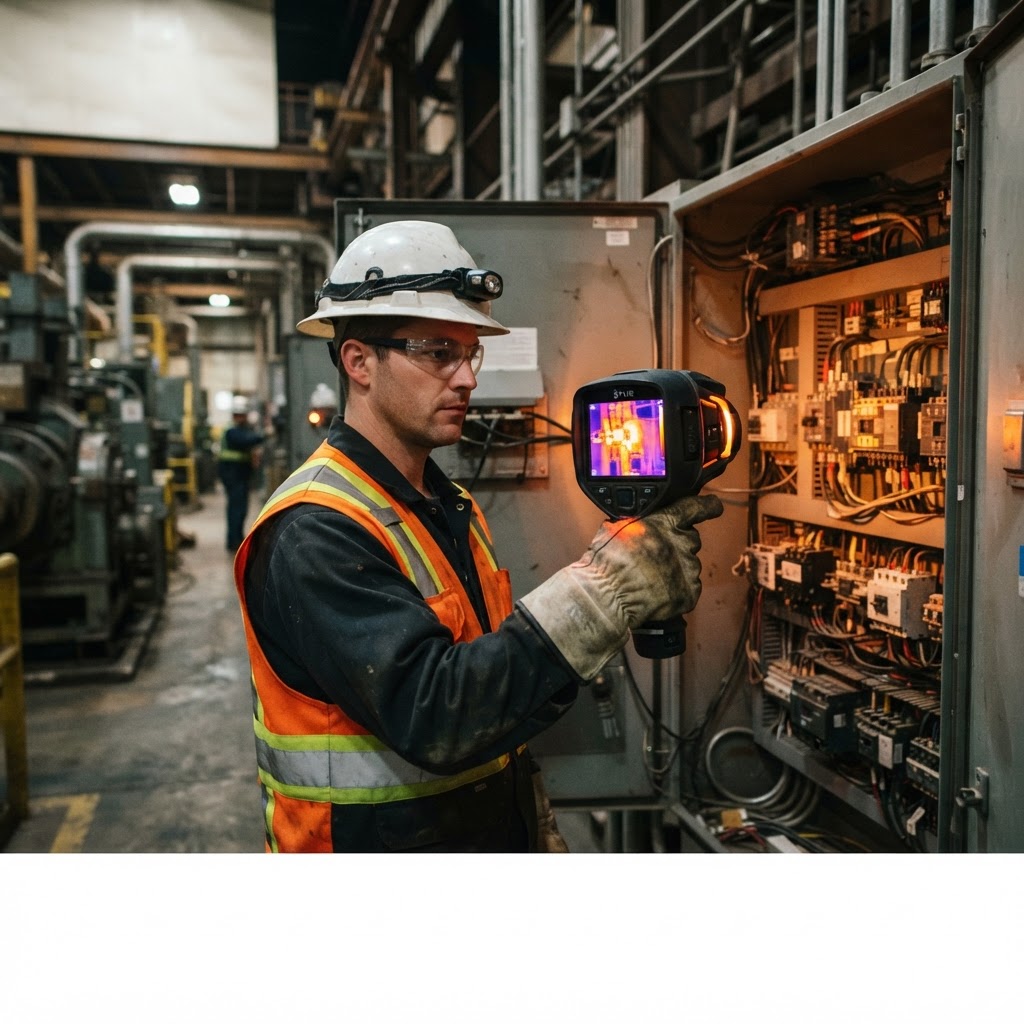
Lead: An electrical panel is the highest-yield thermal scan in a commercial building and the easiest place to misread one. Every number you record is a comparison, not an absolute — a warm breaker is not a fault, and a cool one is not a healthy one until you know what it is carrying. This is how to read a panel in a way your report can defend.
Why panels come first
Panels, disconnects, and distribution boards concentrate the loads that fail: terminations loosen, contacts pit, and neutrals carry harmonic current that a clamp meter will under-report. They are also accessible, predictable, and quick to scan. For a given hour on site, a panel survey finds more actionable defects than any other single target.
Load is the measurement
A thermal scan without a load figure is a picture of nothing. Resistance heating scales with current, so:
- A lightly loaded panel looks healthy even when it is about to fail. A loose lug carrying 20 percent of its rating may show nothing at all.
- The same defect at 80 percent load can be dramatic. Schedule the scan for the building's working load — production hours for a plant, mid-afternoon for an office.
- Load changes during the scan. If breakers are being switched while you image, note it. Two frames of the same panel at different loads are evidence, not a discrepancy.
Record the load, or have the client's electrician record it, and put it in the report next to the images.
Compare like with like
The severity of a thermal anomaly is judged against a reference, not against a temperature:
- Phase to phase on a three-phase circuit, at the same load.
- Breaker to breaker of the same make and rating in the same panel.
- Conductor to conductor in a parallel run.
- Lug to conductor on the same cable — the termination should not be the hottest part of a healthy circuit.
Delta-T between the suspect component and its reference, under the same load, is the number that means something. Most programs put that into bands — a few degrees is routine thermal drift, a moderate delta is a probable deficiency, a large delta is a defined deficiency to be repaired. Use your program's table. The principle is what matters: the anomaly is judged against a sibling, never against a wall-plug rule of thumb you half remember.
Emissivity and reflections will fool you
- Shiny bus bar and bright metal have low and unpredictable emissivity. Apply electrical tape targets to read those surfaces properly, and state the emissivity you used.
- The enclosure itself reflects. A warm hand, a hot light fixture, or a sunlit wall behind you shows up in the panel. Move your angle, and take the image twice from different positions to check whether a hot spot follows you.
- Air movement from a nearby vent or an open door cools a surface while you are measuring it.
- Glass and plastic covers read the cover, not the circuit. Image the panel open, with the cover removed, under the electrician's control.
What a real fault looks like
- A single hot termination — one lug or breaker pole clearly hotter than its neighbours under the same load.
- A localized hot spot with a defined edge, rather than a whole component warming evenly.
- One pole of a three-phase breaker hotter than the other two, which usually points at a bad contact inside the breaker rather than a loose wire.
- A warm neutral on a circuit feeding switching power supplies or drives — harmonic current, and worth investigating even when the phase conductors look fine.
- Heat that follows the conductor rather than sitting at the termination, which suggests an undersized conductor or an overloaded circuit rather than a loose joint.
Document it so somebody can act on it
For every finding, record the panel and circuit designation, the load at the time, the ambient temperature, the delta-T against the reference component, the emissivity setting, and the distance you imaged from. Include a reference image alongside the finding image — a hot spot with nothing to compare it to is an argument, not a report.
Then rank the findings by delta-T and by consequence. A five-degree delta on a critical feeder to a data hall outranks a fifteen-degree delta on a spare breaker feeding nothing.
What thermography cannot do
This matters more than any technique above:
- It does not replace a torque check, a contact resistance test, or a qualified electrician's judgment.
- It cannot see a defect that is not generating heat yet — a loose connection that has not drawn current is invisible.
- It does not authorize anybody to open an energized panel. Panel covers come off under the client's electrical safety program, by qualified persons, in the required arc-rated PPE and outside the arc-flash boundary. Thermography is the camera work; the electrical work belongs to the electrician.
Set a cadence
A baseline scan on a healthy panel is the most valuable scan you will ever take, because it is the reference every later scan is measured against. From there: annual for most commercial distribution, quarterly for critical feeders and anything already carrying a documented deficiency, and a re-scan after any repair to confirm the finding is gone.
Bottom line
Image the panel under real load, compare every suspect component against a sibling carrying the same current, guard against reflections, and put the load and the reference in the report. Everything else in electrical thermography is detail around those four things.
Define severity before you scan, not after
A thermal scan produces temperatures; a report produces decisions. The gap between them is a severity method that you write down before the survey, so the same finding gets the same ranking whoever images it.
1. Scan under real load. Commonly cited practice is to image a panel at roughly 40% of rated load or more. Below that, a genuine fault may not produce a detectable rise, and you will photograph a healthy panel and sign your name to it. Ask the site to hold load for the scan and record the actual figure with every image.
2. Measure the right way. Place spots on the suspect component and on a sibling under the same load, and compute the delta-T from those two spots — not from the hottest pixel in the frame. Note the emissivity setting and the reflected temperature; polished busbar and stainless reflect surrounding heat and will otherwise read as a mystery.
3. Rank against published bands. Many programs adopt NETA-style delta-T bands, which differ by component type — a connection, a breaker, a busbar, a motor — because the same rise means different things in different places. Take the bands from your program or your client's standard and apply them consistently; do not improvise a number in the field.
4. Rank by consequence as well as temperature. A moderate delta on a critical feeder outranks a dramatic delta on a spare breaker, because the question is what happens if it fails. Every finding should carry both the delta-T band and the consequence.
5. Report by exception, with a reference image. Wide shot for location, reference and suspect in one frame, close detail at a fixed distance, the load figure, and the recommended action. That is the package a maintenance planner can act on, and it is what makes the second inspection cheaper than the first.